
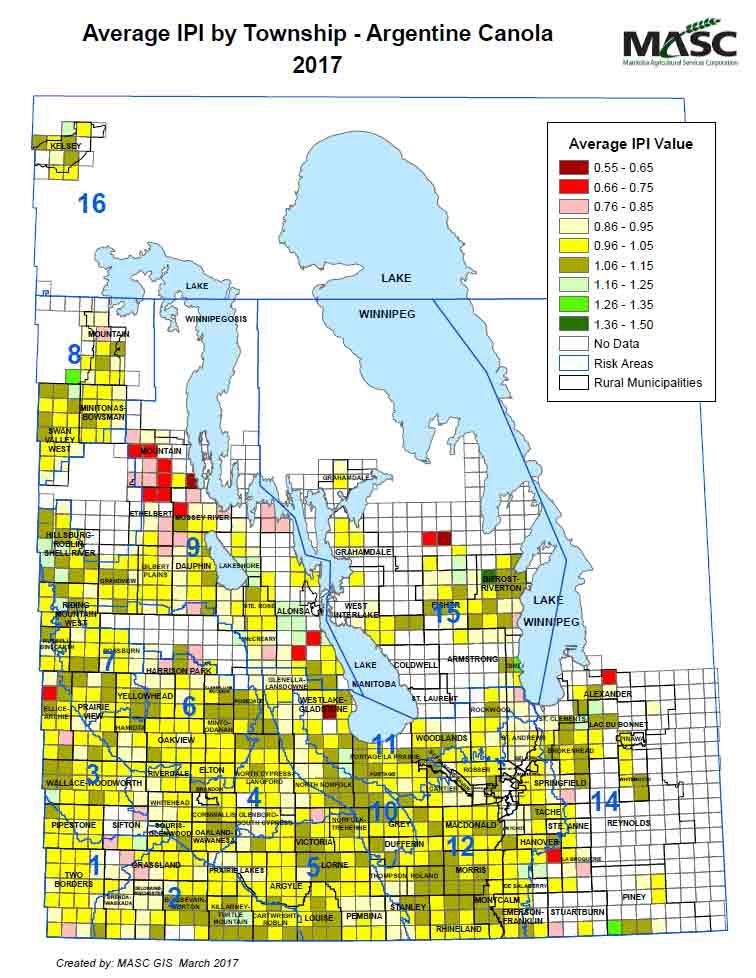
Figure 1: Average IPI by Township: Canola (2017)
Each producer’s IPI is applied to the Probable Yield for the Risk Area to determine an individualized Probable Yield, which is the basis for determining AgriInsurance coverage. Each year, individuals’ crop yields are compared to the average yield for the same crop grown on the same soil classification in the same Risk Area (Soil Zone).
This comparison results in an annual index. As an example, an annual index of 1.1 means that producer’s crop outyielded the Soil Zone average by 10 per cent in that year. Comparing each producer’s yield to the yields of other producers in the same Soil Zone provides a measure of individual performance. On a Risk Area basis, for every producer who gets an annual index greater than 1.0, there is another producer with an annual index less than 1.0. The producer’s annual productivity indices are averaged over 10 years to derive the producer’s IPI for the crop.
A number of stabilizing features are built into the IPI system that are designed to accommodate abnormal events:
- A producer’s annual productivity index cannot fall below 70 per cent or rise above 130 per cent of their established IPI. This buffering does not restrict the absolute level at which their IPI can rise but does restrict the amount due to any one year.
- Losses due to hail, third-party liability damage and wildlife are excluded when calculating IPI.
- Adjustments being made on soil zones are stabilizing, as yields on large areas tend to be less variable than individual yields.
It is important to keep in mind, regardless of how the IPI is calculated, the same overall Risk Area average yield is maintained. If IPI adjusts some yields upward, other yields must be adjusted downward. Ultimately it doesn’t matter if a producer’s average yield is above or below the area average, as over time, yields based on the IPI calculation will be close to the producer’s 10-year average yield.
Common Misconceptions about the IPI System
Size Matters… or Does it?
A common concern of producers is that some Risk Areas are so large that they believe there is distortion in the IPI calculations. IPI is not affected by the size of the measurement area. If the IPI were based on smaller areas (e.g. township), the average yield would also have to be based on that smaller area (the township). This means that the producer will ultimately end up with an IPI calculation close to the producer’s 10-year area average regardless of what size of area is used for comparison.
Responsiveness to Change
Both the Individual Coverage (IC) and IPI systems have a fast-tracking mechanism, which means if a crop is grown for less than five years, there is a phase-in calculation that uses the individual’s yield in combination with the area average.
For each growing year, 20 per cent of the producer’s yield is used. The producer’s IPI is then multiplied by the 10-year average for the Soil Zone, resulting in the producer’s Probable Yield for that year. While one of the benefits of the IPI system is the buffering, it does mean that responsiveness is slow in comparison to the IC system, which is a simple average of the producer’s yields. IC is used for crops like soybeans, grain corn, and vegetables.
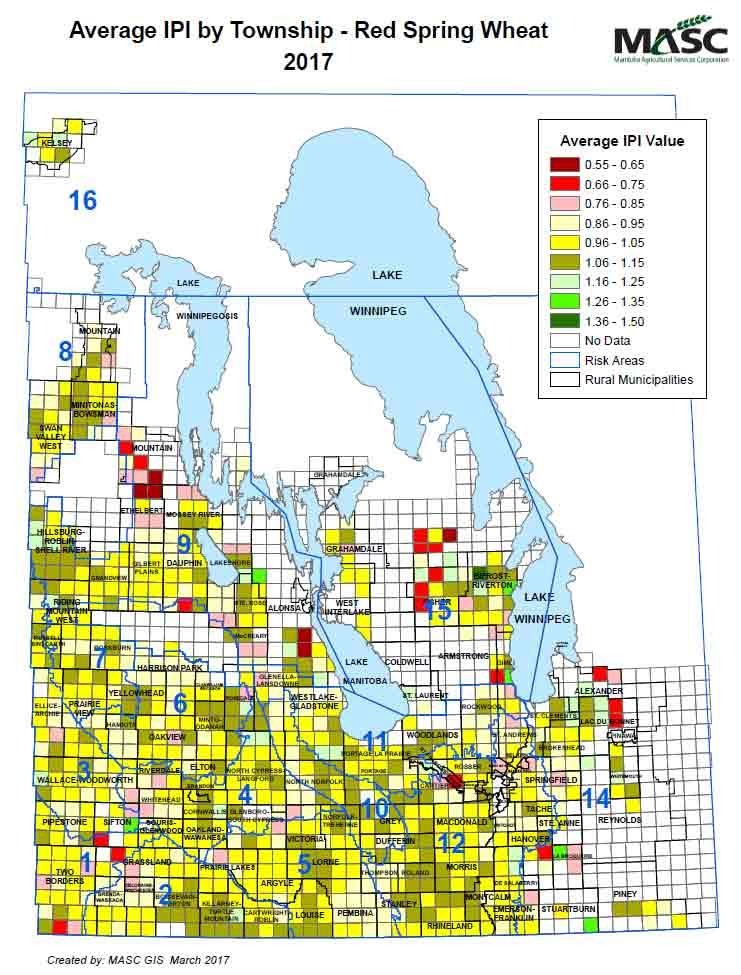
Figure 2: Average IPI by Township: Red Spring Wheat (2017)
But I Didn’t Insure that Crop…
Insured producers are often surprised that an IPI is still calculated for future application when they deselect a crop for insurance. For each year an insured producer grows an IPI crop, an annual index is calculated regardless of whether the producer chose to insure that crop in that year.
IPI is Distorted in Multiple Disaster Years…
Coverage can be adjusted upward even during area-wide disasters, provided the producer’s yields are higher than the Soil Zone average yield. This system individualizes a producer’s coverage, while at the same time buffers against abnormal loss years.
The IPI is Buffered for Both Superior and Subpar Yields…
The system works to end up with the same area average yield for all producers in that Soil Zone. Assigning higher IPIs for some producers and lower IPIs for others will ultimately result in the same area average yield.
A producer’s yield, relative to their neighbours with the same soil type and in the same area, is influenced by many specific management practices and microclimatic factors. Risk Areas have similar topography and long-term climate influences. Few patterns are evident when examining average IPIs for crops across Risk Areas. Maps with the average IPI by township for canola and red spring wheat demonstrate that those with higher IPIs can be side by side with those with below-average IPIs.
On those maps, a producer can compare their IPI to the average of their neighbours in the same township to see how their historical yields stack up.
For example, a producer with an IPI of 0.9 in a township with an average IPI of 0.7 might be considered a better producer than their neighbours; however, on a Risk Area basis an IPI of 0.9 would be considered below average. Similarly, a producer with an IPI of 1.1 in a township with an average IPI of 1.3 could be considered inferior to their neighbours, although on a Risk Area basis an IPI of 1.1 would be considered above average.
While the IPI system provides an accurate reflection of a producer’s productive history, it can be challenging to understand all the details.